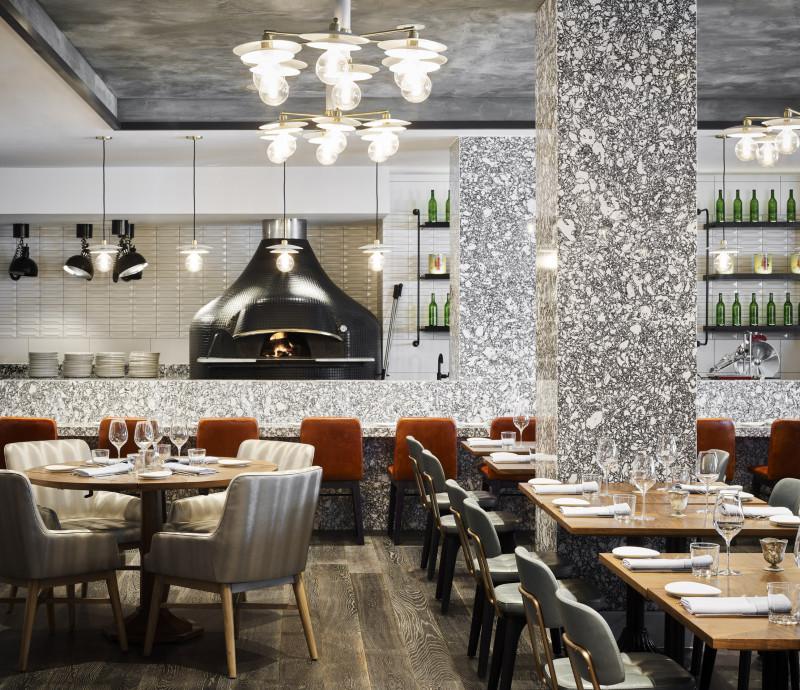
A restaurant is a business that prepares and serves food and drinks to customers, typically for consumption on the premises. However, takeout and delivery options are also common. Restaurants are diverse in terms of cuisine, price point, and service style, ranging from fast-food establishments and family restaurants to upscale, luxury dining experiences. This variety caters to a wide range of customer preferences and budgets.
1920: Prohibition Impacts Fine Dining
In 1920, the implementation of Prohibition significantly impacted fine dining restaurants, as they heavily relied on the profits from selling wine and alcoholic beverages to sustain their operations. This led to the rise of simpler, more casual dining options like cafeterias and diners.
1950: Shift in Dining Habits
In 1950, 25% of meals were consumed outside the home in restaurants or institutions.
1964: Civil Rights Act and Katzenbach v. McClung
In 1964, the Civil Rights Act outlawed segregation in public accommodations, including restaurants. The Supreme Court case Katzenbach v. McClung upheld Congress's power to forbid racial discrimination in restaurants under the Commerce Clause.
1990: Increase in Eating Out
By 1990, the proportion of meals consumed outside the home in restaurants or institutions had risen to 46%.
2000: Restaurant Growth in Vietnam
In 2000, Vietnam had approximately 20,000 restaurants nationwide.
2005: Michelin Releases New York City Guide
In 2005, Michelin released its first guide for the United States, focusing on New York City.
2006: Restaurant Statistics in the United States
As of 2006, there were approximately 215,000 full-service restaurants in the United States, with $298 billion in sales, and 250,000 limited-service (fast food) restaurants, with $260 billion in sales.
2008: Restaurant Industry Growth During Recession
During the 2008 recession, the restaurant industry continued to grow, employing 10 million workers in the United States.
2012: Waiting Staff Employment and Wages
In 2012, the waiting staff in restaurants numbered 4,438,100, earning an average of $8.84 per hour.
2013: Cooks Employment and Wages
In 2013, restaurants employed 912,100 cooks, with an average wage of $9.83 per hour.
2014: American Dining Out Spending
In 2014, Jiaxi Lu of the Washington Post reported that Americans were spending $683.4 billion a year dining out and demanding better food quality and variety.
2016: Restaurant Growth and Eating Habits
In 2016, the United States had 1,000,000 restaurants, equating to one restaurant for every 310 people. A Gallup Poll indicated that nearly 61% of Americans ate out at a restaurant at least once a week.
2016: Americans Spend More on Restaurants Than Groceries
Starting in 2016, Americans began spending more on restaurants than they did on groceries.
October 2017: Restaurant Growth Rate
In October 2017, The New York Times reported that there were 620,000 eating and drinking places in the United States, with the number of restaurants growing almost twice as fast as the population.
2020: Pandemic Impact on Restaurant Sales
In 2020, the National Restaurant Association projected that the COVID-19 pandemic would decrease restaurant sales to $675 billion, a decline of $274 billion from their previous estimate of $899 billion.
2021: Out-of-Home Market Growth in Vietnam
In 2021, the out-of-home market in Vietnam accounted for VND333.69 trillion, up 19% from 2020.
2022: Restaurant Industry Revenue in Vietnam
In 2022, the number of restaurants in Vietnam had increased to over 400,000. The revenue of the restaurant industry in Vietnam reached VND610 trillion, up 16% from 2021.
Mentioned in this timeline
The United States of America is a federal republic located...

A supreme court the court of last resort in many...
Vietnam officially the Socialist Republic of Vietnam is located in...
Trending

8 months ago Stanley Tucci faces wine tourism criticism; 'Tucci in Italy' gets renewed; trattoria impact.

3 months ago Alcaraz Rallies to Victory Against Fritz, Closing in on No. 1 Ranking

2 months ago Josh Hart shines with increased workload, making a case to stay in lineup.
4 months ago Daytona 500 Date Announced for 2027, Creates Fan Uproar Over Scheduling Conflicts

Micah Katt Williams is a well-known American stand-up comedian and actor He is recognized for his roles in various films...
11 months ago Latvia Imposes Entry Ban on Citizens from Russia and Belarus Amid Tensions
Popular

Kid Rock born Robert James Ritchie is an American musician...
The Winter Olympic Games a major international multi-sport event held...

XXXTentacion born Jahseh Dwayne Ricardo Onfroy was a controversial yet...

Barack Obama the th U S President - was the...

Melania Trump a Slovenian-American former model has served as First...

Michael Jordan often known as MJ is a businessman and...
