


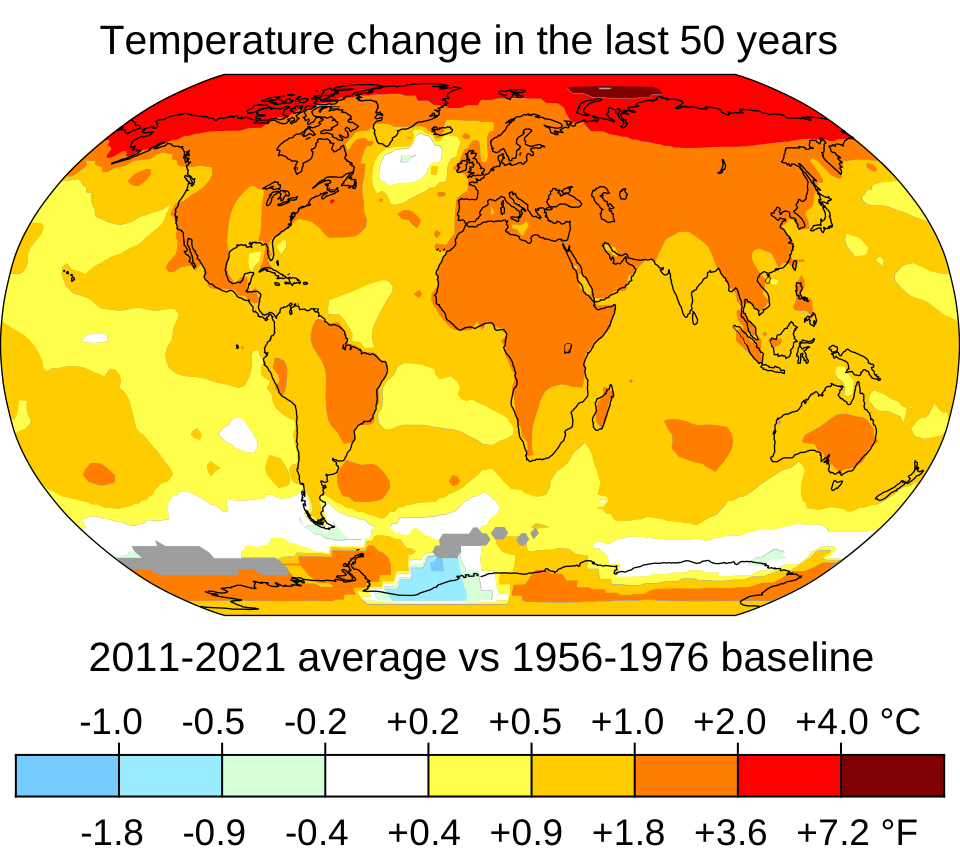
Climate change refers to long-term shifts in global temperatures and weather patterns, primarily driven by human activities since the 1800s. The burning of fossil fuels—such as coal, oil, and gas—releases greenhouse gases like carbon dioxide and methane, which trap heat in the atmosphere, creating a greenhouse effect. This warming trend has led to the melting of polar ice caps, rising sea levels, and an increase in the frequency and intensity of extreme weather events, including heatwaves, droughts, and severe storms. These shifts threaten ecosystems, biodiversity, and human infrastructure, leading to risks for food security, water supply, and public health. Addressing climate change requires a global transition toward renewable energy sources, increased energy efficiency, and sustainable land-use practices. Limiting global temperature rise to 1.5°C above pre-industrial levels is widely considered the critical threshold to avoid the most catastrophic impacts of environmental destabilization. Collective international cooperation and policy shifts are essential to mitigating these risks and ensuring a sustainable future.
1900: End of the Pre-Industrial Baseline
The year 1900 marks the end of the 1850–1900 pre-industrial baseline period, which is used as the standard reference point for calculating global temperature increases.


1961: Beginning of the Global Dimming Observation Period
Starting in 1961, scientists began observing a gradual reduction in the amount of solar radiation reaching the Earth's surface, a trend that continued through 1990 and is now recognized as global dimming caused by aerosol pollution.
1970: Continuous Growth of Global Climate Thermal Energy
Since at least 1970, the global climate system has experienced a consistent increase in thermal energy with only minor, temporary pauses, resulting in over 90% of this excess energy being absorbed and stored within the Earth's oceans.
1970: Shift in Global Temperature Trends
Starting in 1970, a notable rise in global temperatures occurred due to the rising accumulation of greenhouse gases coupled with new regulations on sulfur pollution. Prior to 1970, the warming effects of greenhouse gases had been largely counteracted by the cooling impact of sulfate aerosols from sulfur dioxide emissions.
1975: Early usage of the term Global Warming
In 1975, the term global warming began to be utilized as a descriptor for the phenomenon of rising global temperatures.
1980: Increase in Northern Hemisphere Monsoonal Precipitation
Starting in 1980, observations have indicated an increase in monsoonal precipitation occurring across the Northern Hemisphere, marking a shift in regional climate patterns.
1988: James Hansen's Senate Testimony
During his 1988 testimony before the U.S. Senate, NASA climate scientist James Hansen popularized the term global warming, cementing its usage in public discourse.
1990: Conclusion of Global Dimming Observation and Shift in Aerosol Trends
By 1990, the observed trend of global dimming reached a turning point as pollution control measures began to reduce aerosol concentrations, which in turn diminished the masking effect these particles had on greenhouse gas-driven global warming.
1990: Assessment of Sea Level Rise Projections
In 1990, the evaluation of climate models began showing that previous projections had underestimated the actual rate of sea level rise, a discrepancy that has since been corrected in more modern, observationally aligned models.
1998: Start of the Global Warming Hiatus
Beginning in 1998, the Earth entered a period known as the global warming hiatus, driven by the negative phases of the Pacific Decadal Oscillation and Atlantic Multidecadal Oscillation, which temporarily slowed the rate of surface warming.
2000: Projected Long-Term Sea Level Rise
Scientific analysis indicates that as a result of accumulated climate change, an estimated total sea level rise of 2.3 meters per degree Celsius is projected to occur over the course of 2000 years, alongside the potential for irreversible melting of the West Antarctic ice sheet.
2001: Commencement of Major Deforestation Tracking Period
In 2001, a significant period for tracking land use began, marking the start of a study that identified how deforestation contributed to global warming through the loss of carbon sinks. Over the following years, researchers analyzed how activities like agricultural expansion, logging, and wildfires resulted in the permanent or temporary clearing of forest lands between 2001 and 2018.
2013: Conclusion of the Global Warming Hiatus
The period of slower surface warming, referred to as the global warming hiatus, concluded in 2013 after lasting for 15 years.
2014: Beginning of the 2014-2023 Warming Decade
Starting in 2014 and continuing through 2023, the global surface temperature experienced a significant increase, reaching an average of 1.19 °C above the pre-industrial baseline.
2014: Beginning of increased sea level rise observation period
Starting in 2014, researchers began tracking a period characterized by an accelerated increase in global sea levels, which was attributed to thermal expansion and the melting of polar ice, culminating in a rate of 4.8 cm per decade by the end of 2023.
2015: The Paris Agreement
In 2015, international nations established the Paris Agreement, a collective commitment aimed at limiting global warming to well under 2 °C above pre-industrial levels.
2017: Publication of the National Climate Assessment
In 2017, the United States published the National Climate Assessment, which highlighted that current climate models might still fail to capture or correctly estimate critical feedback processes within the global climate system.
2018: Conclusion of Long-term Deforestation Analysis
By 2018, researchers concluded a comprehensive assessment of global forest loss, revealing that since 2001, 27% of deforestation was driven by permanent agricultural clearing, 24% by shifting cultivation, 26% by logging, and 23% by wildfires. This 2018 data highlighted the critical need for forest restoration to recapture lost carbon sink capacity.
2019: Global Greenhouse Gas Emissions Report
In 2019, human-caused greenhouse gas emissions reached a total equivalent to 59 billion tonnes of CO2. The composition of these emissions consisted of 75% carbon dioxide, 18% methane, 4% nitrous oxide, and 2% fluorinated gases, stemming from sectors including fossil fuel combustion, industrial processes, agriculture, and waste management.
2020: Implementation of Ship Fuel Sulfur Content Reductions
Starting in 2020, regulations were implemented to decrease the sulfur content of fuel oil used by ships, a change that scientists estimate will contribute to a 0.05 °C increase in global mean temperatures by 2050 due to the reduction of reflective aerosol cooling effects.
2021: IPCC Sixth Assessment Report Projections
In 2021, the IPCC Sixth Assessment Report was released, presenting climate projections through 2100. The report indicated that global warming could range from 1.0–1.8 °C in very low emission scenarios to 3.3–5.7 °C in very high emission scenarios, noting that temperatures could continue to rise significantly by the year 2300.
2022: Record Increase in Greenhouse Gas Concentrations
In 2022, data indicated that atmospheric concentrations of CO2 and methane had risen by approximately 50% and 164% respectively, compared to levels recorded in 1750. These measurements highlight that current CO2 levels are unprecedented in the last 14 million years, while methane concentrations have reached their highest point in at least 800,000 years, largely due to human fossil fuel consumption.
2023: End of decadal sea level rise observation period
By 2023, data confirmed that global sea levels had risen at a rate of 4.8 cm per decade over the preceding ten-year period, driven by the ongoing impacts of melting glaciers and ice sheets.
2023: Conclusion of the 2014-2023 Warming Decade
By 2023, the decade-long period showed a recorded average warming of 1.19 °C compared to the baseline period of 1850–1900.
2023: UNEP Carbon Budget Assessment
In 2023, the United Nations Environment Programme (UNEP) determined that to maintain a 50% probability of limiting global warming to below 2.0 °C, cumulative CO2 emissions following 2023 must not surpass 900 gigatonnes, a threshold equivalent to approximately 16 years of current global emissions.
2024: Post-Hiatus Temperature Spike
In 2024, global temperatures rose significantly, exceeding the recent decadal average with an increase of more than +1.5 °C, marking a reversal of the previous hiatus trend.
2024: Record-Breaking Global Temperatures
In 2024, the Earth experienced its warmest year on record since systematic global temperature tracking commenced in 1850, reaching an anomaly of +1.60 °C (2.88 °F).
2024: WMO Global Temperature Forecast Begins
Starting in 2024, the World Meteorological Organization began tracking a five-year period with a nearly 50% probability that global temperatures will exceed the +1.5 °C threshold relative to historical averages.
2028: WMO Global Temperature Forecast Conclusion
By the year 2028, the World Meteorological Organization's forecast period concludes, highlighting a heightened risk of global warming exceeding the +1.5 °C mark for the five-year average.
2050: Projected Mortality from Climate Change
According to a report by the World Economic Forum, climate change is expected to cause 14.5 million additional deaths worldwide by the year 2050 due to its various environmental impacts.
2050: Projected Temperature Impact of Black Carbon and Sulfur Regulations
By 2050, it is projected that reducing black carbon deposits in the Arctic could mitigate global warming by 0.2 °C, while the long-term impact of reducing sulfur content in ship fuel starting from 2020 is estimated to cause a 0.05 °C increase in global mean temperature by the year 2050.
Mentioned in this timeline

Greta Thunberg is a Swedish climate activist who gained international...

Al Gore served as the th U S Vice President...

NASA the National Aeronautics and Space Administration is the U...

China officially the People's Republic of China PRC is located...

A bank is a regulated financial institution licensed to accept...

Japan is an East Asian island country located in the...
Trending
10 days ago Karrueche Tran Reacts to Unexpected Nickname from Deion Sanders' Grandson
5 hours ago Miami President Discusses Potential ACC Exit and Realignment to Big Ten or SEC

5 hours ago Bill Ackman Discusses Meta Investments and Criticizes Democratic Party Figures
6 hours ago Nasdaq Drops Amid AI Spending Concerns and Rising Oil Prices

6 hours ago JJ Watt Named New CBS Lead NFL Analyst Replacing Tony Romo
6 hours ago Josh O'Connor Delivers Knockout Performance in Highly Acclaimed London West End Production
Popular

Ilhan Omar is a prominent American politician currently serving as...

Ken Paxton is an American politician and lawyer serving as...

Michael Joseph Jackson the King of Pop was a highly...

Elon Musk is a visionary entrepreneur and engineer known for...

Cristiano Ronaldo widely considered one of the greatest footballers captains...

Linda Ronstadt is a versatile American singer renowned for her...