
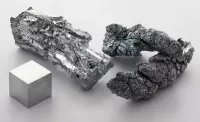
Copper is a chemical element (Cu, atomic number 29) known for its softness, malleability, and ductility, as well as its exceptional thermal and electrical conductivity. Exhibiting a pinkish-orange hue when freshly exposed, copper is widely used as a conductor of heat and electricity. It also serves as a building material and a key component in various metal alloys, including sterling silver, cupronickel, and constantan, used in jewelry, marine hardware/coins, and temperature measurement devices, respectively.
1900: Increase in Copper Mining
Since 1900, more than 95% of all copper ever mined and smelted has been extracted, highlighting a significant increase in copper usage and extraction in the 20th and 21st centuries.
1949: First Application of Flash Smelting
In 1949, Outokumpu in Finland first applied flash smelting at Harjavalta, marking the beginning of an energy-efficient process that now accounts for 50% of the world's primary copper production.
1950: Increase in Copper Reserves
Since 1950, in-ground copper reserves have increased more than 700%, from almost 100 million tonnes to 720 million tonnes by 2017, showing a substantial growth in available copper resources.
1965: Removal of Silver from US Coins
In 1965, circulating silver was removed from all US coins except for the half dollar, which was debased to an alloy of 40% silver and 60% copper.
1967: Formation of the Intergovernmental Council of Copper Exporting Countries
In 1967, Chile, Peru, Zaire, and Zambia formed the Intergovernmental Council of Copper Exporting Countries to operate in the copper market similarly to OPEC in oil, aiming to influence copper prices and production.
1970: End of Silver in Half Dollars
Between 1965 and 1970, the US half dollar was debased to an alloy of 40% silver and 60% copper, marking a transition in the composition of US coinage.
1988: Dissolution of the Intergovernmental Council of Copper Exporting Countries
In 1988, the Intergovernmental Council of Copper Exporting Countries was dissolved, having never achieved the same level of influence as OPEC, particularly due to the non-membership of the United States, the second-largest producer.
1992: Closure of the Great Copper Mountain
In 1992, the Great Copper Mountain mine in Falun, Sweden, closed after operating from the 10th century, ending a long period of significant copper production and its impact on the Swedish economy.
2000: End of the Bronze Age in the Near East
Around 2000 BC the Bronze Age ended with the beginning of the Iron Age in the Near East, marking a technological shift in tool and weapon production.
2000: Alloying Copper with Tin
Around 2000 years after "natural bronze" had come into general use, alloying copper with tin to make bronze was first practiced, marking a significant development in metallurgy.
2001: Copper Content in Automobiles
In 2001, a typical automobile contained 20–30 kg of copper, illustrating the significant use of copper in the automotive industry.
2001: Updated Dietary Recommendations for Copper
In 2001, the U.S. Institute of Medicine updated the estimated average requirements (EARs) and recommended dietary allowances (RDAs) for copper, setting specific intake levels for different age groups and conditions such as pregnancy and lactation, and also setting Tolerable Upper Intake Levels (ULs).
2005: Chile as Top Copper Producer
In 2005, according to the British Geological Survey, Chile was the top producer of copper, holding at least one-third of the world's share, followed by the United States, Indonesia, and Peru.
2007: Copper from recycled sources
From 2007 to 2017, more than 30 percent of copper installed came from recycled sources, demonstrating the increasing role of recycling in copper supply.
2008: China becomes World's Largest Copper Importer
In 2008, China became the world's largest importer of copper, a position it has maintained as of at least 2023, highlighting its significant role in the global copper market.
2011: Copper–zinc alloy handrails installed in Santiago subway system
Between 2011 and 2014, copper–zinc alloy handrails were installed in some 30 stations in the subway transit system in Santiago, Chile to leverage copper's antimicrobial properties.
2014: Copper–zinc alloy handrails installed in Santiago subway system
Between 2011 and 2014, copper–zinc alloy handrails were installed in some 30 stations in the subway transit system in Santiago, Chile to leverage copper's antimicrobial properties.
2014: Decrease in Copper Content in Internal Combustion Engine Vehicles
By 2014, the copper content in internal combustion engine vehicles decreased to 16.8 kg, reflecting changes in manufacturing and material usage.
2017: Copper from recycled sources
From 2007 to 2017, more than 30 percent of copper installed came from recycled sources, demonstrating the increasing role of recycling in copper supply.
2017: Copper Reserves reach 720 million tonnes
In 2017, in-ground copper reserves had increased more than 700% since 1950, reaching 720 million tonnes, despite world refined usage more than tripling in the last 50 years.
2019: Revised Daily Value for Copper
In 2019, the Daily Value for copper in U.S. food and dietary supplement labeling was revised to 0.9 mg to align with the RDA, affecting how copper content is expressed on product labels.
2019: Environmental Cost of Copper Mining
In 2019, the estimated environmental cost of copper mining was 3.7 kg CO2-eq per kg of copper, highlighting the carbon footprint associated with copper production.
2020: Codelco's CO2 Emissions
In 2020, Codelco, a major copper producer in Chile, reported emissions of 2.8 t CO2-eq per ton (2.8 kg CO2-eq per kg) of fine copper, providing specific data on the emissions from a major industry player.
2022: Peak and Fall of Copper Price
In 2022, the price of copper reached a peak but unexpectedly fell afterwards, indicating volatility in the copper market.
2023: China remains World's Largest Copper Importer
As of 2023, China has continued to be the world's largest importer of copper since 2008, highlighting its significant role in the global copper market.
2023: Recycled Copper Supplies One-Third of Global Demand
As of 2023, recycled copper supplies about one-third of global demand, emphasizing the importance of recycling in meeting the world's copper needs.
2023: Increase in Copper Content in Internal Combustion Engine and Battery Electric Vehicles
In 2023, the copper and copper alloy content of internal combustion engine vehicles increased to 24.5 kg, while a battery electric vehicle contained around 91 kg of copper and copper alloys, showcasing the growing importance of copper in both types of vehicles.
2023: Projected World Copper Production
In 2023, the total world production of copper is expected to be almost 23 million metric tons, driven by the increasing demand for copper due to the energy transition to electricity, with China accounting for over half the demand.
May 2024: Record High Copper Price
In May 2024, the price of copper on the London Metal Exchange reached an all-time high, exceeding $11,000 per ton, reflecting increased demand and market pressures.
2024: Chile supplies US with 70% of refined copper and alloy imports
Through 2024, Chile, the world's largest copper producer, supplies the US with 70% of refined copper and alloy imports. Together with Canada (17%) and Peru (7%), they account for 94% of U.S. copper imports.
Mentioned in this timeline

China officially the People's Republic of China PRC is located...

The Organization of the Petroleum Exporting Countries OPEC is a...

Indonesia is a Southeast Asian and Oceanian country situated between...

Earth the third planet from the Sun is unique in...

Sweden officially the Kingdom of Sweden is a Nordic country...
Zinc is a chemical element with the symbol Zn and...
Trending

3 hours ago Natalie Portman Distances Herself From Rachel Cusk's Scathing Novel
3 hours ago Jordan Henderson Departs Brentford Amid Transfer Speculation to Chelsea

3 hours ago YES and MSG Networks Move Regional Sports Streaming to DAZN Platform

3 hours ago Jeffrey Dean Morgan Faces Thanksgiving Ban Over Mount Rushmore Snub
4 hours ago Boston Scientific Lowers Annual Profit Outlook Amid Restructuring Efforts

4 hours ago US and Saudi Forces Launch Joint Military Strikes Against Iran-Backed Militias in Iraq
Popular

Lindsey Graham is a prominent American politician serving as the...

Johnny Depp is a highly successful American actor musician and...

LeBron James nicknamed King James is an American professional basketball...

Anthony Stephen Fauci is a prominent American physician-scientist and immunologist...

Nancy Grace is an American legal commentator and television journalist...

Bernie Sanders is a prominent American politician and the senior...