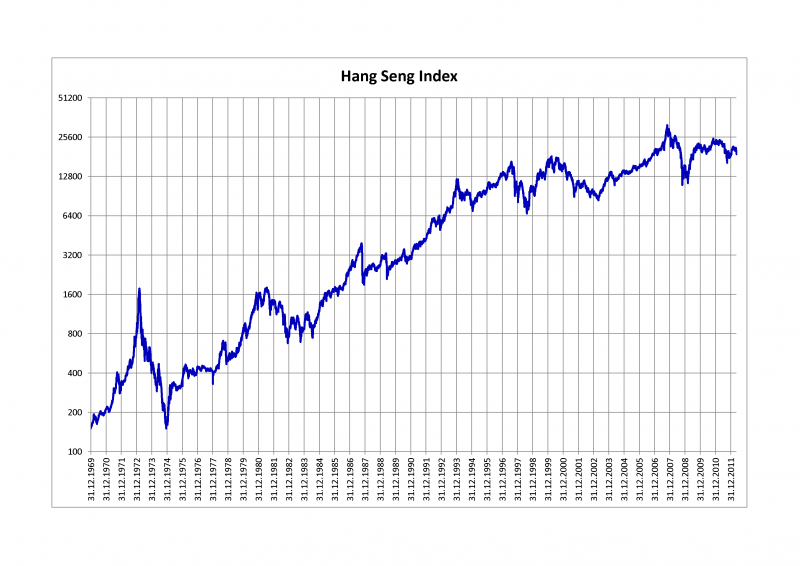
The Hang Seng Index (HSI) is a market-capitalization-weighted stock market index in Hong Kong, adjusted for free float. It serves as the main indicator of Hong Kong's overall market performance by tracking the daily price movements of the largest companies listed on the Hong Kong Stock Exchange. The index comprises 82 constituent companies, representing roughly 58% of the exchange's total market capitalization.
July 31, 1964: Base of 100 points set
On July 31, 1964, when the Hang Seng Index was first published, its base of 100 points was set equivalent to the stocks' total value as of the market close.
August 31, 1967: All-time low reached
On August 31, 1967, the Hang Seng Index reached its all-time low of 58.61 points, retroactively, after the base value was established but before the publication of the index.
November 24, 1969: HSI publicized
On November 24, 1969, the Hang Seng Index (HSI) was publicized. It is compiled and maintained by Hang Seng Indexes Company Limited, a subsidiary of Hang Seng Bank.
January 2, 1985: Sub-indices established
On January 2, 1985, four sub-indices were established in order to make the index clearer and to classify constituent stocks into four distinct sectors.
December 10, 1993: 10,000 point milestone passed
On December 10, 1993, the Hang Seng Index passed the 10,000 point milestone for the first time in its history.
October 3, 2001: Hang Seng Composite Index Series launched
On October 3, 2001, the Hang Seng Composite Index Series was launched, targeting on providing a broad standard of the performance of the Hong Kong stock market.
December 28, 2006: 20,000 point milestone passed
On December 28, 2006, the Hang Seng Index passed the 20,000 point milestone.
October 18, 2007: 30,000 point milestone passed
On October 18, 2007, the Hang Seng Index passed the 30,000 point milestone.
October 30, 2007: Index lost points
From October 30, 2007, the Hang Seng Index lost 9,426 points.
March 9, 2008: Index lost points
Through March 9, 2008, the Hang Seng Index lost approximately 30%.
October 8, 2008: Lowest closing value in over two years
On October 8, 2008, the Hang Seng Index closed at 15,431.73, over 50% less than the all-time high and the lowest closing value in over two years.
October 27, 2008: Index fell to 10,676.29 points
On October 27, 2008, the Hang Seng Index further fell to 10,676.29 points, nearly two-thirds from its all-time peak.
March 8, 2010: Hang Seng Composite Index Series revamped
On March 8, 2010, the Hang Seng Composite Index Series was last revamped.
August 9, 2010: Constituents will become 306
From August 9, 2010, Hang Seng Composite Index Series constituents will become 306.
August 19, 2014: Index reached 25,000.00
On August 19, 2014, the Hang Seng Index reached 25,000.00, reaching as high as 25,201.21 that day, later closing at 24,909.26 points.
April 8, 2015: Index hit 26,000
On April 8, 2015, the Hang Seng Index hit 26,000, with a close of 26,236.86.
April 13, 2015: Index rose to over 28,000 points
On April 13, 2015, the Hang Seng Index rose to over 28,000 points, closing to 28,016.34, the highest since December 2007.
July 8, 2015: Index fell
On July 8, 2015, the Hang Seng Index fell as much as 2139 points.
June 24, 2016: Market fell due to UK EU referendum results
On 24 June 2016, the market fell 1,000 points in response to UK EU referendum results that "Leave" won the vote against "Remain".
January 26, 2018: All-time high set
On January 26, 2018, the Hang Seng Index set its all-time high at 33,223.58 points at closing.
February 2024: 82 HSI constituent stocks
As of February 2024, there are 82 HSI constituent stocks in total.
Mentioned in this timeline

The stock market serves as a platform where buyers and...
Hong Kong is a Special Administrative Region of the People's...

Stocks were a type of restraining device historically used as...

A bank is a financial institution that plays a crucial...

Stocks represent fractional ownership of a corporation granting shareholders a...
A referendum is a direct vote by the electorate on...
Trending
8 months ago Burkina Faso Forces Accused of Killing Civilians in March Attack, HRW Reports.

New Year's Eve observed on December st marks the final day of the year in the Gregorian calendar Celebrations worldwide...

7 months ago Betty White's Name Used in Hudson Bay Polar Bear Study, Stealing the Show
The Chicago Cubs are a professional baseball team based in Chicago Illinois Founded in and officially named the Cubs in...
7 months ago Russian Bridges Collapse: Train Derailment Claims Lives Near Ukraine, Leaving Seven Dead
25 days ago CD Projekt Dashes Cyberpunk 2077 Anniversary Teaser Hopes, Confirms No New Content
Popular

Stranger Things created by the Duffer Brothers is a popular...

XXXTentacion born Jahseh Dwayne Ricardo Onfroy was a controversial yet...
Turning Point USA TPUSA is an American nonprofit organization founded...

Bernie Sanders is a prominent American politician currently serving as...

Jupiter is the fifth and largest planet from the Sun...

Candace Owens is an American conservative political commentator and author...
