
The stock market is where buyers and sellers trade stocks, representing ownership in businesses. This includes publicly listed securities and privately traded shares. Investment strategies guide participation in these markets.
October 24, 1929: Black Thursday - Start of the 1929 crash
On October 24, 1929, also known as Black Thursday, one of the most famous stock market crashes started. The Dow Jones Industrial Average lost 50% during this stock market crash, marking the beginning of the Great Depression.
1929: Regulation of margin requirements after the crash of 1929
Regulation of margin requirements (by the Federal Reserve) was implemented after the Crash of 1929.
1929: Start of the stock market crash in 1929
The names "Black Monday" and "Black Tuesday" are also used for October 28–29, 1929, which followed Terrible Thursday—the starting day of the stock market crash in 1929.
1929: Wall Street Crash of 1929
There have been famous stock market crashes that have ended in the loss of billions of dollars and wealth destruction on a massive scale, like the Wall Street Crash of 1929.
1960: Worker to beneficiary ratio in 1960
Economic and financial theories argue that stock prices are affected by macroeconomic trends such as decreasing worker to beneficiary ratio (year 1960 5:1).
1973: Stock market crash of 1973-4
There have been famous stock market crashes that have ended in the loss of billions of dollars and wealth destruction on a massive scale, like the stock market crash of 1973–4.
1980: Market capitalization in 1980
In 1980, the total market capitalization of all publicly traded stocks worldwide was US$2.5 trillion.
1986: Introduction of CATS trading system in 1986
In 1986, the CATS trading system was introduced to the Paris Bourse, which is now part of Euronext. This introduction fully automated the order matching system.
October 19, 1987: Black Monday - The 1987 crash
On October 19, 1987, another famous crash, known as Black Monday, took place. The crash began in Hong Kong and quickly spread around the world.
1987: The 1987 crash
In 1987, the crash raised some puzzles. For some time after the crash, trading in stock exchanges worldwide was halted, since the exchange computers did not perform well owing to enormous quantity of trades being received at one time.
1987: Stock market crash in 1987
The 'hard' efficient-market hypothesis does not explain the cause of events such as the crash in 1987, when the Dow Jones Industrial Average plummeted 22.6 percent—the largest-ever one-day fall in the United States.
1987: Black Monday of 1987
There have been famous stock market crashes that have ended in the loss of billions of dollars and wealth destruction on a massive scale, like the Black Monday of 1987.
1992: Stock Ownership in 1992
In 1992, direct ownership of stock by individuals was 17.8%, while indirect participation in the form of retirement accounts was 39.3%.
2000: Dot-com bubble of 2000
There have been famous stock market crashes that have ended in the loss of billions of dollars and wealth destruction on a massive scale, like the dot-com bubble of 2000.
2003: Paper on stock participation rates in 2003
In 2003, a paper by Annette Vissing-Jørgensen suggested that a fixed cost of $200 per year is sufficient to explain why nearly half of all U.S. households do not participate in the stock market.
2006: Making Economic Sense published in 2006
Murray Rothbard's book "Making Economic Sense" was published in 2006.
October 2007: Beginning of the Great Recession in October 2007
October 2007 marked the beginning of the Great Recession, during which financial markets experienced a sharp decline. From October 2007 to March 2009, the S&P 500 fell 57%.
2007: Stock Ownership in 2007
In 2007, direct ownership of stock by individuals rose slightly to 17.9%, with the median value rising to $17,000. Indirect participation in the form of retirement accounts rose to 52.6%, with the median value more than doubling to $45,000.
2008: Financial crisis scrutiny in 2008
Events such as the 2008 financial crisis prompted a heightened degree of scrutiny of the impact of the structure of stock markets on the stability of the financial system and the transmission of systemic risk.
2008: Great Recession in 2008
Since the Great Recession of 2008, households in the bottom half of the income distribution lessened their participation rate both directly and indirectly.
March 2009: S&P 500 decline in March 2009
From October 2007 to March 2009, the S&P 500 fell 57% during the Great Recession.
2009: Worker to beneficiary ratio in 2009
Economic and financial theories argue that stock prices are affected by macroeconomic trends such as decreasing worker to beneficiary ratio (year 2009 3:1).
2011: Stock market ownership in 2011
As of 2011, the national rate of direct participation in the stock market was 19.6%, with white households at 24.5%, black households at 6.4%, and Hispanic households at 4.3%.
February 2012: Single-stock circuit breakers introduced in February 2012
In February 2012, the Investment Industry Regulatory Organization of Canada (IIROC) introduced single-stock circuit breakers.
2012: Stock markets role in growing industries in 2012
According to Padhi and Naik in 2012, stock markets play an essential role in growing industries that ultimately affect the economy through transferring available funds from units that have excess funds (savings) to those who are suffering from funds deficit (borrowings).
2012: S&P 500 Index Performance
In 2012, the S&P 500 index was part of a period from 2012-2021 that experienced an average annual return of 14.8%, although individual years can have fluctuating returns.
April 2013: S&P 500 recovery in April 2013
By April 2013, the S&P 500 recovered to its 2007 levels, following the sharp declines during the Great Recession.
2013: Stock holdings value in 2013
In 2013, the households in the bottom half of the income distribution lessened their participation rate both directly and indirectly from 53.2% in 2007 to 48.8% in 2013, while over the same period households in the top decile of the income distribution slightly increased participation 91.7% to 92.1%.
2016: Stock Exchanges in 2016
As of 2016, there were 60 stock exchanges in the world, with 16 having a market capitalization of $1 trillion or more, accounting for 87% of global market capitalization. These 16 exchanges were primarily located in North America, Europe, or Asia, with the exception of the Australian Securities Exchange.
February 20, 2020: Start of the 2020 stock market crash
The 2020 stock market crash started on February 20, 2020 due to the COVID-19 pandemic.
2021: S&P 500 Index Performance
In 2021, the S&P 500 index concluded a period from 2012-2021 that experienced an average annual return of 14.8%, although individual years can have fluctuating returns.
2021: World stock markets increase in value in 2021
In 2021, the value of world stock markets increased by 26.5%, amounting to US$22.3 trillion. Developing countries contributed US$9.9 trillion and developed countries US$12.4 trillion. Asia and Oceania accounted for 45%, Europe had 37%, and America had 16%, while Africa had 2% of the global market.
January 2022: Largest Stock Markets in January 2022
As of January 2022, the largest stock markets by country were in the United States of America (about 59.9%), followed by Japan (about 6.2%) and the United Kingdom (about 3.9%).
2023: Market capitalization in 2023
By the end of 2023, the total market capitalization of all publicly traded stocks worldwide rose to US$111 trillion.
2030: Worker to beneficiary ratio in 2030
Economic and financial theories argue that stock prices are affected by macroeconomic trends such as decreasing worker to beneficiary ratio (year 2030 2.2:1).
Mentioned in this timeline

Hong Kong is a densely populated special administrative region of...
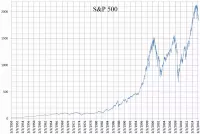
The S P is a stock market index that tracks...

Africa is the second-largest and second-most populous continent home to...

The Dow Jones Industrial Average DJIA often called the Dow...

Japan is an East Asian island country located in the...

Canada is a North American country spanning from the Atlantic...
Trending
9 months ago Danny Welbeck's Career Revival: A Potential Return to England's World Cup Squad?
4 hours ago FBI Captures Most Wanted Fraudster in $32 Million COVID Relief Scheme

5 hours ago New Documentary Explores Wham!'s Historic and Surreal Concert Tour of China
4 hours ago Dominic Sessa Praised for Performance in Upcoming Anthony Bourdain Biopic Tony

5 hours ago Sean Astin Reflects on Hollywood Career and Lord of the Rings Financial Struggles

6 hours ago Ukrainian Drone Attacks Target Strategic Sites and Kill Five in Southern Russia
Popular

Nancy Grace is an American legal commentator and television journalist...

Lindsey Graham is a prominent American politician serving as the...

Cristiano Ronaldo widely considered one of the greatest footballers captains...

Johnny Depp is a highly successful American actor musician and...

LeBron James nicknamed King James is an American professional basketball...
Buc-ee's is an American chain of large country stores gas...