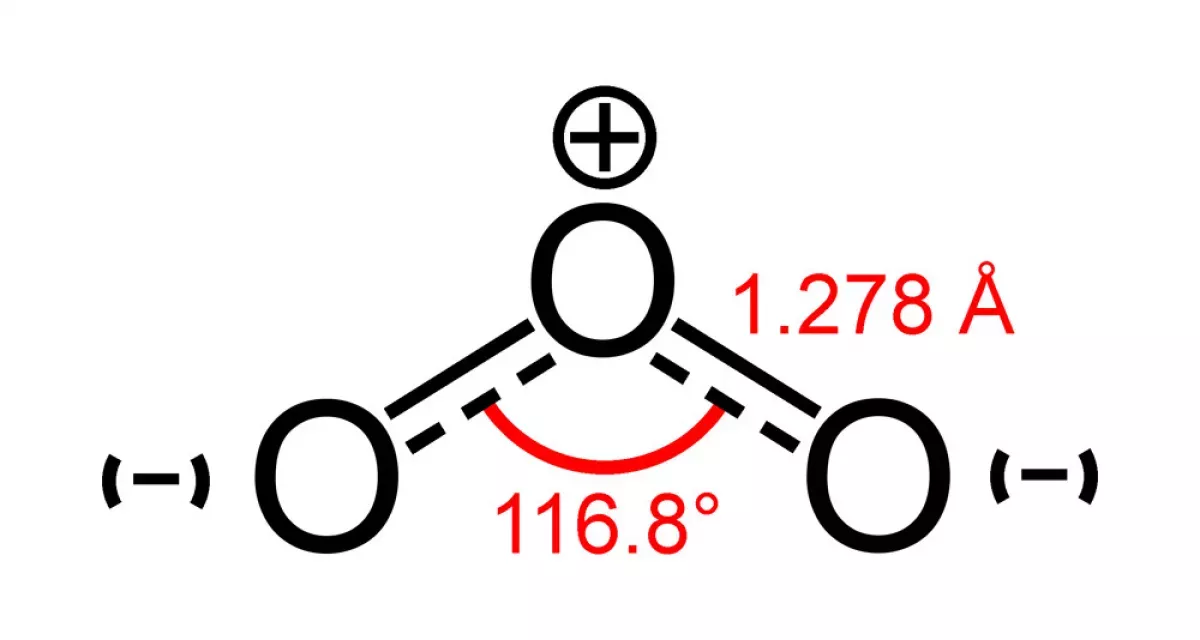
Ozone (O3) is a pale blue, pungent-smelling inorganic molecule and allotrope of oxygen. It's formed when ultraviolet (UV) light or electrical discharges act on dioxygen (O2). Less stable than O2, it breaks down in the lower atmosphere. While present in low concentrations throughout the atmosphere, ozone is most concentrated in the stratospheric ozone layer, where it absorbs the majority of the Sun's harmful ultraviolet radiation. This absorption is crucial for protecting life on Earth from damaging UV rays.
1908: Ozonisation of London Underground introduced
In 1908, artificial ozonisation of the Central Line of the London Underground was introduced for aerial disinfection.
1910: OSHA permissible exposure limit for ozone established
The U.S. Occupational Safety and Health Administration has established a permissible exposure limit (PEL) of 0.1 μmol/mol for ozone, calculated as an 8-hour time weighted average, as defined by 29 CFR 1910.1000 table Z-1.
1911: Harmful effects of ozone inhalation
In 1911, Leonard Hill and Martin Flack published findings in the Proceedings of the Royal Society B, stating that the belief in ozone's healthful effects was unfounded. They found that the only well-established effect of ozone was that it caused irritation and edema of the lungs, and death if inhaled in relatively strong concentration for any time.
1923: Georg-Maria Schwab refutes the oxozone hypothesis
In 1923, Georg-Maria Schwab successfully solidified ozone and performed accurate analysis which conclusively refuted the oxozone hypothesis. This was part of his doctoral thesis under Ernst Hermann Riesenfeld.
1955: Tropospheric ozone effects
Starting in 1955 and continuing to 2000, tropospheric ozone was shown to be responsible for approximately 30% of upper Southern Ocean interior warming.
1956: Ozonisation of London Underground phased out
By 1956, artificial ozonisation of the Central Line of the London Underground was phased out. However the beneficial effect was maintained by the ozone created incidentally from the electrical discharges of the train motors.
1987: Montreal Protocol established
In 1987, the Montreal Protocol was established. This led to a ban on the production of many ozone-depleting chemicals due to concerns over the health effects of ozone decline in the stratosphere.
1997: 8-hour ozone standard
In 2004, the EPA allotted the Denver Metro/North Front Range as non-attainment areas per 1997's 8-hour ozone standard, but later deferred this status until 2007. The non-attainment standard indicates that an area does not meet the EPA's air quality standards.
2000: Tropospheric ozone effects
Starting in 1955 and continuing to 2000, tropospheric ozone was shown to be responsible for approximately 30% of upper Southern Ocean interior warming.
2003: Ozone and heat effects during European heat waves
In 2003, an investigation assessing the joint mortality effects of ozone and heat during the European heat waves concluded that these effects appear to be additive.
2004: Denver Metro/North Front Range area designated as non-attainment
In 2004, the EPA allotted the Denver Metro/North Front Range as non-attainment areas per 1997's 8-hour ozone standard, but later deferred this status until 2007. The non-attainment standard indicates that an area does not meet the EPA's air quality standards.
2007: Denver Metro/North Front Range area status deferred
In 2004, the EPA allotted the Denver Metro/North Front Range as non-attainment areas per 1997's 8-hour ozone standard, but later deferred this status until 2007. The non-attainment standard indicates that an area does not meet the EPA's air quality standards.
May 2008: EPA lowered ozone standard
In May 2008, under a court order, the EPA lowered its ozone standard from 80 nmol/mol to 75 nmol/mol, although its scientists and advisory board had recommended lowering the standard to 60 nmol/mol.
2008: Colorado Ozone Action Plan created
In 2008, the Colorado Ozone Action Plan was created, which includes plans to evaluate emission controls for large industrial sources of NOx and statewide control requirements for new oil and gas condensate tanks and pneumatic valves.
2008: EU ozone concentration target value
In accordance with Directive 2008/50/EC, the EU's current target value for ozone concentrations is 120 μg/m.
2008: Primary standard set
In the 2008 final rule, the 8-hour primary standard was set at 0.075 μmol/mol.
January 7, 2010: EPA announced proposed revisions to the National Ambient Air Quality Standard (NAAQS)
On January 7, 2010, the U.S. Environmental Protection Agency (EPA) announced proposed revisions to the National Ambient Air Quality Standard (NAAQS) for the pollutant ozone, the principal component of smog.
January 2010: EU ozone concentration target value enforcement begins
Starting January 2010, the EU's target value for ozone concentrations, which is 120 μg/m, should not be exceeded on more than 25 calendar days per year, in accordance with Directive 2008/50/EC.
2011: Regional Haze Plan released
In 2011, the Regional Haze Plan was released, which included a more specific plan to help decrease NOx emissions.
October 26, 2015: EPA published a final rule revising the 8-hour primary NAAQS
On October 26, 2015, the EPA published a final rule revising the 8-hour primary NAAQS from 0.075 ppm to 0.070 ppm, with an effective date of December 28, 2015.
December 28, 2015: EPA rule revision becomes effective
On December 28, 2015, the EPA's final rule revising the 8-hour primary NAAQS from 0.075 ppm to 0.070 ppm became effective.
2021: Ozone generators made available to schools
In the Autumn term 2021, ozone generators were made available to schools and universities in Wales for aerial disinfection of classrooms after COVID-19 outbreaks.
2022: Crop loss due to ozone pollution in East Asia
A 2022 study concludes that East Asia loses 63 billion dollars in crops per year due to ozone pollution, a byproduct of fossil fuel combustion. China loses about one-third of its potential wheat production and one-fourth of its rice production.
Mentioned in this timeline
China officially the People's Republic of China PRC is an...
Colorado a Mountain and Southwestern U S state is the...

Trains are a connected series of vehicles traveling on railway...
Climate change encompasses global warming and its far-reaching effects on...

Heat in thermodynamics is defined as energy transferred between a...
Trending

6 months ago Breanna Stewart injured, Liberty cautious with Sabally, NY seeks winning streak.

2 months ago Candice Romo Opens Up About Tony Romo; Cowboys Face Chiefs on Thanksgiving.
The modern Olympic Games are a leading international sporting event held every four years featuring both Summer and Winter Games...

7 months ago Severe Storms Kill Three, Cause Power Outages in Central New York

John Robert Spillane is a professional American football linebacker currently playing for the Las Vegas Raiders in the NFL Before...

Teddy Bridgewater is a professional American football quarterback currently playing for the Tampa Bay Buccaneers He played college football at...
Popular

Thomas Douglas Homan is an American law enforcement officer who...

Martin Luther King Jr was a pivotal leader in the...

XXXTentacion born Jahseh Dwayne Ricardo Onfroy was a controversial yet...

Instagram is a photo and video-sharing social networking service owned...

William Franklin Graham III commonly known as Franklin Graham is...

Jupiter is the fifth and largest planet from the Sun...
