
A stock market crash is characterized by a rapid and substantial decrease in stock prices across a significant portion of the market, leading to substantial paper wealth losses. These crashes are typically fueled by panic selling, which can be triggered by underlying economic problems or the bursting of speculative bubbles. They often follow periods of rampant speculation and unsustainable economic growth, creating a volatile market vulnerable to sudden corrections.
1907: Stock prices fall by nearly 50%
In 1907, stock prices fell by nearly 50% due to manipulation of copper stocks by the Knickerbocker Trust Company, leading to panic and the closure of investment trusts and banks.
1908: Panic continues after the stock prices fall
In 1908, the panic that started in 1907 continued, leading to further economic instability.
1913: Formation of the Federal Reserve
In 1913, the Federal Reserve was formed as a result of the panic that started in 1907 and continued to 1908.
August 24, 1921: Dow Jones Industrial Average at 63.9
On August 24, 1921, the Dow Jones Industrial Average (DJIA) was at 63.9.
September 3, 1929: Dow Jones Industrial Average at 381.2
On September 3, 1929, the Dow Jones Industrial Average (DJIA) had risen to 381.2, more than sixfold since August 24, 1921.
November 11, 1929: Index stands at 228 after cumulative drop
By November 11, 1929, the index stood at 228, a cumulative drop of 40% from the September high.
July 1932: DJIA bottoms out after losing 89% of its value
In July 1932, the DJIA finally bottomed out after losing 89% of its value, marking the end of a significant decline.
1963: Benoit Mandelbrot suggests statistics prove the assumption incorrect.
In 1963, Benoit Mandelbrot suggested that the statistics prove this assumption incorrect and observed that large movements in prices (i.e. crashes) are much more common than would be predicted from a log-normal distribution.
1963: Mandelbrot proposes stock price variations follow a Lévy flight
In 1963, Mandelbrot proposed that stock price variations followed a Lévy flight, a random walk occasionally disrupted by large movements, instead of a strict random walk.
August 1982: Dow Jones Industrial Average at 776
In August 1982, the Dow Jones Industrial Average (DJIA) was at 776.
August 1987: Dow Jones Industrial Average peaks at 2722
In August 1987, the Dow Jones Industrial Average (DJIA) rose to 2722, marking a peak in a period of strong economic optimism.
October 1987: Major world markets crash or decline substantially
In October 1987, all major world markets crashed or declined substantially, with most industrial countries experiencing declines greater than 20%.
October 1987: George Soros on the 1987 Crash
In late October 1987, George Soros said, "Mr. Robert Prechter's reversal proved to be the crack that started the avalanche."
October 19, 1987: Black Monday: DJIA plummets 508 points
On October 19, 1987, known as Black Monday, the DJIA plummeted 508 points, losing 22.6% of its value. The S&P 500 Index dropped 20.4%, and the NASDAQ Composite lost 11.3% due to market system failures.
1987: DJIA gains 0.6% during calendar year
During the calendar year 1987, the DJIA gained 0.6% despite the crash.
1987: Introduction of trading curbs after Black Monday
Following Black Monday in 1987, trading curbs, or "circuit breakers", were introduced as a mitigation strategy. These curbs halt trading in both the cash market and the derivative markets based on substantial movements in a broad market indicator to prevent speculative gains and dramatic losses within a short time frame.
1987: Introduction of circuit breaker on the NYSE
In 1987, one of the consequences of the Crash was the introduction of the circuit breaker or trading curb on the NYSE.
1987: Black Monday
In 1987, the event known as Black Monday occurred, but it did not lead to a bear market.
1987: Reasons behind the 1987 Crash
In 1987, the reasons behind the crash were analyzed, with blame apportioned to factors such as program trading, portfolio insurance, derivatives, and worsening economic indicators.
1987: Comparison to Black Monday
In 2008, older traders were comparing the current meltdown with Black Monday in 1987.
1987: Largest daily decline since Black Monday
On March 12, 2020, the DJIA declined 9.99%, marking the largest daily decline since Black Monday in 1987.
September 1989: Market Regains all lost value from the 1987 crash
By September 1989, the market had regained all of the value it had lost in the 1987 crash, recovering completely in two years.
1995: Mantegna and Stanley analyze S&P 500 Index records
In 1995, Rosario Mantegna and Gene Stanley analyzed a million records of the S&P 500 Index, calculating the returns over a five-year period to further the study of stock price variations.
October 9, 2007: DJIA at its peak of 14,164
On October 9, 2007, the DJIA reached its peak of 14,164 before declining.
September 15, 2008: Bankruptcy of Lehman Brothers
On September 15, 2008, the bankruptcy of Lehman Brothers and the collapse of Merrill Lynch triggered a global crisis due to exposure to subprime loans and credit default swaps.
October 11, 2008: IMF warns of systemic meltdown
On October 11, 2008, the head of the International Monetary Fund (IMF) warned that the world financial system was teetering on the "brink of systemic meltdown".
October 24, 2008: World's stock exchanges experience worst declines in history
On October 24, 2008, many of the world's stock exchanges experienced the worst declines in their history, with drops of around 10% in most indices.
2008: Biggest downward weekly drop since the 2008 financial crisis
During the week of February 24-28, 2020, stock markets experienced the biggest downward weekly drop since the 2008 financial crisis.
2008: Dow Jones Industrial Average fell over 1,874 points
From October 6–10, 2008, the Dow Jones Industrial Average (DJIA) fell over 1,874 points, or 18%, in its worst weekly decline ever on both a points and percentage basis.
2008: Crash of 2008
In 2008, the meltdown was being called the Crash of 2008, being compared to Black Monday in 1987.
March 6, 2009: DJIA drops 54% to 6,469
By March 6, 2009, the DJIA had dropped 54% to 6,469 from its peak on October 9, 2007.
2011: S&P 500 plunges after US credit rating downgrade
In 2011, following Standard & Poor's downgrade of the United States' credit rating on August 5th, the S&P 500 plunged 6.68%, wiping out nearly $2.5 trillion in market value.
2011: Research identifies imitation among investors as crash warning
In 2011, research at the New England Complex Systems Institute found that panics leading to crashes stem from a dramatic increase in imitation among investors, which always occurred during the year before each market crash.
February 2020: Reference Point for Stock market recovery
By the end of May 2020, the stock market indices briefly recovered to their levels at the end of February 2020.
March 9, 2020: Major stock market indices fall after oil price war launch
On March 9, 2020, after the launch of the 2020 Russia–Saudi Arabia oil price war, major stock market indices fell, including the FTSE and S&P 500 Index.
March 12, 2020: Stock prices fall sharply after travel ban announcement
On March 12, 2020, stock prices fell sharply after a travel ban from Europe was announced, with the DJIA declining 9.99% – the largest daily decline since Black Monday (1987).
March 16, 2020: DJIA drops 12.93% after recession becomes inevitable
On March 16, 2020, after it became clear that a recession was inevitable, the DJIA dropped 12.93%, or 2,997 points, the largest point drop since Black Monday (1987).
May 2020: Stock market indices briefly recover
By the end of May 2020, the stock market indices briefly recovered to their levels at the end of February 2020.
June 2020: Nasdaq surpasses pre-crash high
In June 2020, the Nasdaq surpassed its pre-crash high, signaling a recovery.
2020: Stock markets drop as COVID-19 pandemic spreads
During the week of February 24–28, 2020, stock markets dropped as the COVID-19 pandemic spread globally, with the FTSE 100 dropping 13% and the DJIA and S&P 500 Index dropping 11–12%.
April 2, 2025: The 2025 stock market crash begins
On April 2, 2025, a major stock market crash began in the United States as a result of worldwide tariffs put in place by US President Donald Trump. This crash is the largest decline in the US stock market since the COVID-19 pandemic.
April 9, 2025: Trade Policy with 10% tariffs
On April 9, 2025, Trade policies with 10% tariffs on all imported goods went into effect, resulting in loss of points for Dow and S&P 500.
May 2025: US stock market recovered
By the second week of May 2025, the US stock market had recovered from the crash that occurred shortly after the tariffs were announced.
Mentioned in this timeline

George Soros is a Hungarian-American investor and philanthropist with a...

The stock market is where buyers and sellers trade stocks...

Saudi Arabia officially the Kingdom of Saudi Arabia KSA is...

Hong Kong is a densely populated special administrative region of...
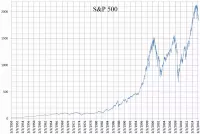
The S P is a stock market index that tracks...

The Dow Jones Industrial Average DJIA often called the Dow...
Trending

3 hours ago Juan Soto Stars With Spider-Man In New Brand New Day Commercial
3 hours ago San Diego Comic-Con Panelists Revealed and Negative Reviews for Will Ferrell's The Hawk

3 hours ago Joe Flacco Comments Spark Media Buzz Involving Joe Burrow and Shedeur Sanders

3 hours ago Pete Buttigieg Emerges as Top Contender in Michigan 2028 Presidential Poll

4 hours ago John Leguizamo Critiques Stephen Miller and Challenges Birthright Citizenship Critics
4 hours ago Sarah Ashlee Barker Shines as a Key Player in Alabama Women's Basketball
Popular

Lindsey Graham is a prominent American politician serving as the...

Cristiano Ronaldo widely considered one of the greatest footballers captains...

Mitch McConnell is a prominent American politician and the longest-serving...

Elon Musk is a visionary entrepreneur and engineer known for...

Candace Owens is an American conservative political commentator author and...

Bernie Sanders is a prominent American politician and the senior...