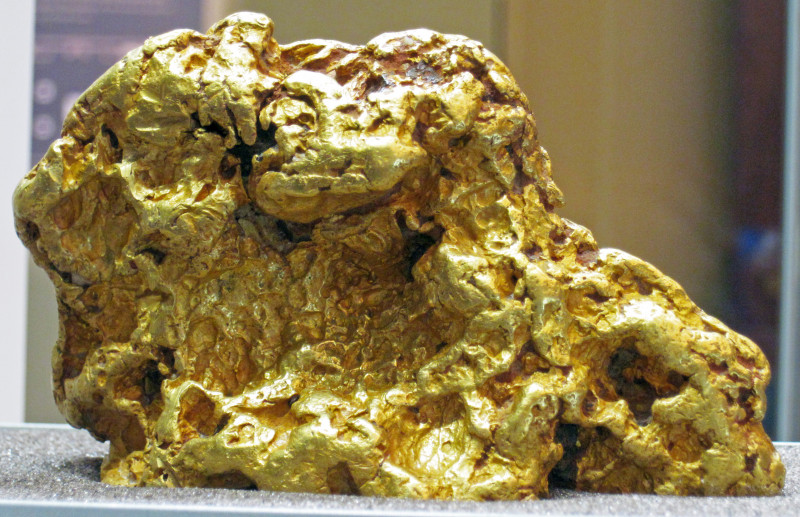
Gold is a chemical element with the symbol Au and atomic number 79. It's a bright yellow, dense, soft, malleable, and ductile metal in its pure form. Classified as a transition metal, group 11 element, and noble metal, gold is one of the least reactive elements, second only to platinum. It remains solid under standard conditions.
1900: First Written Reference to Gold
Around 1900 BC, the first written reference to gold was recorded in the 12th Dynasty of Ancient Egypt. Egyptian hieroglyphs from as early as 2600 BC also describe gold.
1901: Second Boer War
The Second Boer War of 1899–1901 between the British Empire and the Afrikaner Boers was partly over the rights of miners and possession of the gold wealth in South Africa.
1905: South Africa as Largest Gold Producer
Since 1905, South Africa was the world's largest gold producer.
1910: Increased Gold Extraction
As of 1910, 75% of the gold currently accounted for has been extracted, indicating a significant increase in gold mining and extraction.
September 1919: Origin of the Gold Fixing in London
In September 1919, the Gold Fixing in London originated, providing a daily benchmark price for the gold industry.
1924: First Synthesis of Gold
In 1924, Japanese physicist Hantaro Nagaoka achieved the first synthesis of gold from mercury through neutron bombardment, marking a significant scientific milestone.
1934: US Dollar Devaluation
In 1934, the US dollar was devalued, changing the gold standard from $20.67 to $35.00 per troy ounce.
1941: American Team Synthesizes Radioactive Gold
In 1941, an American team replicated Nagaoka's experiment, synthesizing gold from mercury via neutron bombardment and confirming the radioactive nature of the resulting gold isotopes, validating previous research.
1950: Continued Increase in Gold Extraction
As of 1950, two-thirds of the gold currently accounted for has been extracted, reflecting a continued increase in gold mining and extraction activities.
1961: Market Manipulation Agreement
In 1961, a pool of US and European banks agreed to manipulate the market to prevent further currency devaluation against increased gold demand.
1967: Release of the South African Krugerrand
The South African Krugerrand, a bullion coin made of 22k gold, was first released in 1967.
1968: Introduction of Afternoon Gold Fixing
In 1968, the afternoon fixing was introduced to the Gold Fixing in London, providing a price when US markets are open.
1968: Gold Price Range Begins
In 1968, the price of gold began to range widely.
1970: South Africa's Peak Gold Production
In 1970, South Africa's gold production accounted for 79% of the world's supply, totaling about 1,480 tonnes, marking its peak contribution to global gold production.
August 1971: Nixon Shock
After August 15, 1971, the Nixon Shock occurred, leading to a significant increase in the price of gold.
1971: End of Gold Convertibility in the US
In 1971, the United States refused to redeem its dollars in gold, leading to the abandonment of gold standards and the direct convertibility of currencies to gold by world governments. Fiat currency now fulfills most monetary roles.
1971: Nixon Shock and the End of the Gold Standard
In 1971, the world gold standard was abandoned for a fiat currency system following the Nixon shock measures, marking a significant shift in monetary policy.
January 1980: Gold Price Peak
On January 21, 1980, the price of gold reached a high of $850 per troy ounce ($27.33/g).
1980: Transmutation of Bismuth into Gold
In 1980, Glenn Seaborg successfully transmuted several thousand atoms of bismuth into gold at the Lawrence Berkeley Laboratory, although manufacturing gold in this way remains highly impractical and costly.
1986: First Coining of Australian Gold Kangaroos
The Australian Gold Kangaroos were first coined in 1986 as the Australian Gold Nugget.
1988: Ocean Gold Concentrations
Measurements taken in 1988 revealed that gold concentrations in the Atlantic and Northeast Pacific oceans are 50–150 femtomol/L, but prior reports overstated these figures due to contamination issues.
1989: Reverse Design Change for Australian Gold Kangaroos
In 1989, the Australian Gold Kangaroos, initially coined as the Australian Gold Nugget in 1986, underwent a change in their reverse design.
1990: Earliest Gold Artifacts from the Levant
As of 1990, gold artifacts found at the Wadi Qana cave cemetery of the 4th millennium BC in the West Bank were determined to be the earliest examples from the Levant.
1997: Recycled Gold Supply
In 1997, recycled gold accounted for approximately 20% of the 2700 tons of gold supplied to the market.
June 1999: Gold Price Low
On June 21, 1999, the price of gold hit a low of $252.90 per troy ounce ($8.13/g) during the London Gold Fixing.
1999: Switzerland Ends Currency Tie to Gold
In 1999, Switzerland was the last country to tie its currency to gold; this was ended by a referendum.
2000: Gold Price Range Ends
In 2000, the price of gold stopped ranging widely.
April 2001: Start of Gold Price Increase
From April 2001, spot gold prices began to increase in value.
2001: Gold Price Increase Begins
From 2001, gold prices began to increase rapidly.
2001: Gold Metal Allergen of the Year
In 2001, gold metal was voted Allergen of the Year by the American Contact Dermatitis Society, affecting mostly women.
2004: Microbes in Gold Deposit Formation
A 2004 research paper suggests that microbes play a role in forming gold deposits by transporting and precipitating gold into grains and nuggets found in alluvial deposits.
2004: Analysis of a Magnetar Flare
Analysis of a 2004 magnetar flare showed that these events produce heavy elements through the same r-process as neutron star mergers, helping to explain gold's presence in older stars.
2005: World Gold Supply and Demand
In 2005, the World Gold Council estimated the total global gold supply to be 3,859 tonnes and demand to be 3,754 tonnes, resulting in a surplus of 105 tonnes.
2006: American Buffalo Gold Bullion Coin Production
In 2006, the United States Mint started producing the American Buffalo gold bullion coin with a purity of 99.99%.
2007: China Overtakes South Africa in Gold Production
In 2007, China surpassed South Africa as the world's largest gold producer for the first time since 1905, with a production of 276 tonnes.
2007: Global Gold Mine Production Costs
In 2007, the average gold mining and extraction costs were approximately $317 per troy ounce, varying based on mining type and ore quality. Global mine production amounted to 2,471.1 tonnes.
January 2008: Gold Price Exceeds 1980 High
On January 3, 2008, the price of gold exceeded the 1980 high, reaching a new maximum of $865.35 per troy ounce.
March 2008: Record Gold Price
On March 17, 2008, a record price of $1023.50 per troy ounce ($32.91/g) was set for gold.
December 2009: Gold Closes at New High
On December 2, 2009, gold reached a new high closing at $1,217.23.
May 2010: Gold Rallies After EU Debt Crisis
In May 2010, gold rallied, hitting new highs after the European Union debt crisis prompted further purchase of gold as a safe asset.
March 2011: Gold Hits All-Time High
On March 1, 2011, gold hit a new all-time high of $1432.57, based on investor concerns regarding ongoing unrest in North Africa and the Middle East.
August 2011: Gold Reaches All-Time High
On August 23, 2011, spot gold prices hit a new all-time high of $1,913.50, prompting speculation that the long secular bear market had ended and a bull market had returned.
2013: Gold Deposition During Earthquakes
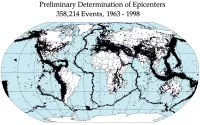
According to a 2013 study, water in faults vaporizes during an earthquake, leading to the deposition of gold. This process occurs approximately 10 kilometers below the surface, where water carries high concentrations of carbon dioxide, silica, and gold, and the sudden opening of a fault jog during an earthquake causes the water to vaporize and deposit gold.
2014: Decline in Gold Price
In late 2014, the price of gold began a slow decline towards $1200 per troy ounce.
2015: Decline in Gold Price
In late 2015, the price of gold continued its slow decline towards $1200 per troy ounce.
2016: Global Gold Accounting
According to the United States Geological Survey in 2016, approximately 5,726,000,000 troy ounces (178,100 t) of gold have been accounted for, with 85% remaining in active use.
August 2017: Direct Observation of Gold from Neutron Star Merger
In August 2017, the GW170817 neutron star merger event led to the direct spectroscopic observation of heavy elements, including gold, confirming neutron star mergers as a significant source of gold. This single event generated between 3 and 13 Earth masses of gold.
August 2018: Start of Gold Growth Period
From August 2018, the gold price began a growth period.
August 2020: Discovery of Islamic Gold Coins in Yavne
In August 2020, Israeli archaeologists discovered a trove of 425 early Islamic gold coins near Yavne. These coins, dating to the late 9th century from the Abbasid Caliphate, are considered an extremely rare collection.
August 2020: Gold Price Increase
In August 2020, the gold price picked up to US$2060 per ounce after a total growth of 59% from August 2018 to October 2020.
October 2020: End of Gold Growth Period
The gold price had a total growth of 59% from August 2018 to October 2020.
2020: Global Gold Reserves
As of 2020, approximately 201,296 tonnes of gold existed above ground, forming a cube with 21.7-meter sides. Its consumption is primarily for jewelry, investments, and industrial uses.
2020: Carbon Dioxide Emissions in Gold Mining and Recycling
As of 2020, mining a kilogram of gold produced 16 tonnes of carbon dioxide CO2, while recycling a kilogram of gold produced 53 kilograms of CO2 equivalent. Approximately 30 percent of the global gold supply is recycled and not mined.
November 2022: Gold in Electrical Connectors
As of November 2022, 10% of the world consumption of new gold produced goes to industry for fabrication of corrosion-free electrical connectors. A typical cell phone may contain 50 mg of gold, worth about three dollars.
September 2023: Discovery of Novel Metal-Halide Perovskite
In September 2023, a novel type of metal-halide perovskite material consisting of Au+ and Au3+ cations in its crystal structure was discovered, showing unexpected stability under normal conditions.
October 2025: Gold Valuation
As of October 2025, gold was valued at approximately $127 per gram ($3,950 per troy ounce).
2025: Magnetar Flares as Gold Source
In 2025, researchers confirmed that giant flares from magnetars are a significant source of gold formation, resolving a paradox. Analysis of a 2004 magnetar flare showed these events produce heavy elements.
Mentioned in this timeline
India officially the Republic of India is a South Asian...

Patagonia is a geographically diverse region spanning Argentina and Chile...
China officially the People's Republic of China PRC is an...
Africa is the second-largest and second-most populous continent comprising of...

An earthquake is the shaking of the Earth's surface caused...
Australia officially the Commonwealth of Australia encompasses the Australian mainland...
Trending
3 months ago Shandong Province sees Gemara discovery, increased German investment, and innovation center launch.
5 months ago Finland Urges US Military Presence Amidst Putin's Actions and Baltic Security Concerns

2 months ago Analyst Predicts Apple Deal, Intel Stock Rises, but Impact Questioned.

2 months ago Powerball Jackpot Reaches $719M: Winning Numbers Announced November 29th, Check Your Tickets!
3 months ago AI Transforms McKinsey's Business Model and SaaS Pricing Strategies Analyzed.
3 months ago Typhoon Kalmaegi Devastates Philippines: Hundreds Dead, Another Storm Threatens Hope
Popular

Kid Rock born Robert James Ritchie is an American musician...
The Winter Olympic Games a major international multi-sport event held...

XXXTentacion born Jahseh Dwayne Ricardo Onfroy was a controversial yet...

Melania Trump a Slovenian-American former model has served as First...

Barack Obama the th U S President - was the...

Billie Eilish is a prominent American singer-songwriter who rose to...
